Ventilation performances
HOME <Environmental Solutions < <Indoor Air Quality CFD assessment < Ventilation performancesThere are several methods or indices used to assess the performance of a ventilation system. These methods give good indications on the thermal comfort, uniformity and ventilation effectiveness inside the space. At EASTechnology, we combined well established methods (ASHRAE Guide) with CFD results to calculate the following indices:
Thermal comfort
The thermal comfort method is one of the indices used to evaluate the performance of a ventilation system inside a building. This method is based on the energy balance to calculate the Predicted Mean Vote (PMV) and Predicted Percentage Dissatisfied (PPD) proposed by Fanger. The thermal comfort is a measure of how people react to the surrounding environment. The PMV index varies from -3 (human response to a very cold environment) to +3 (human response to a very hot environment). A value of zero (0) represents a thermally neutral response. The PPD is directly related to the PMV and is considered good if its value is less than 20%. This value corresponds to a PMV values ranged between -0.5 and 0.5.
At EASTechnology, we developed a method to predict the PMV and PPD inside a building based on CFD results of velocity and temperature. The PMV and PPD can be predicted in the entire computational domain or at selected zones. Then, a volume integral can be performed to estimate the PMV and PPD for the entire space. Statistical values of PMV and PPD such as minimum, maximum and standard deviation can also be provided.
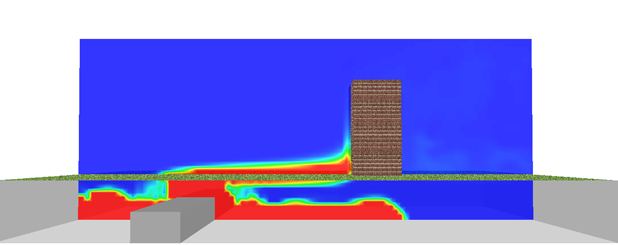
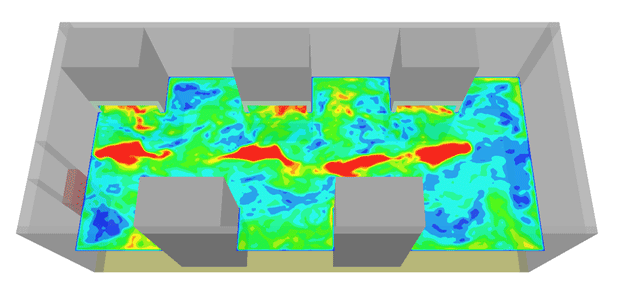
For a clean laboratory application, the PMV and PPD was calculated and is shown the below figures.

PMV values inside the space – Clean laboratory application |

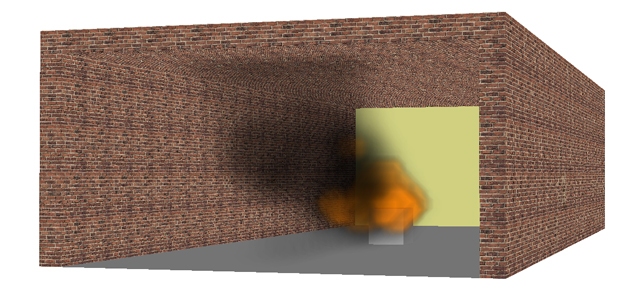
PPD values inside the space – Clean laboratory application |
For this application, a volume weighted average values of -0.8 and 20% were obtained for PMV and PPD respectively.
Uniformity of the Air Diffusion Performance Index (ADPI)
In some cases, two different zones within the space may produce acceptable PMV and PPD, for instance low temperature with low velocity and high temperature with high velocity. However, the passage from one zone to another will be discomfort to an occupant. To deal with such situation, it is useful to check the uniformity in the Air by using the Air Diffusion Performance Index (ADPI). This index measures the degree of mixing in zones within the space. In another word, ADPI defines the percent of locations in a space with low velocity and low range of draught temperatures. The low volume in the space is defined as a volume with velocity lower than 0.35 m/s (70 fpm). The low range of the draught temperature is defined between -1.7oC (3oF) and +1.1oC (2oF) from the mean temperature.
Similarly to the thermal comfort, we developed a method to estimate the ADPI distribution in the space using the CFD results. Then, a volume integral is performed to calculate the average value of the ADPI within the space. A value of ADPI close to the unity means good air ventilation. This method is illustrated in the figures below using the clean lab example for which the PMV and PPD were calculated.

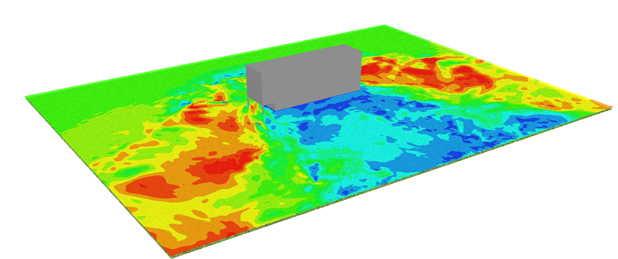
Draught temperature in the space – Clean laboratory |

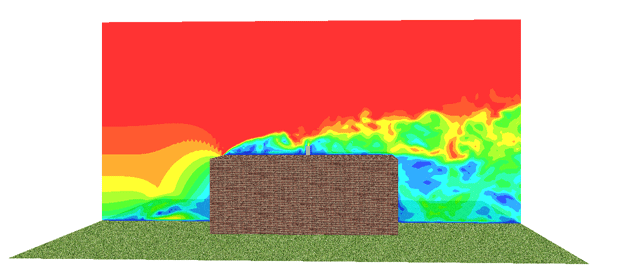
Air velocity (<0.35 m/s) in the space – Clean laboratory |
For this case, the predicted average ADPI in the lab is about 93 %.